Horizontal Logo CMYK Full Colour.png)
How can we provide post-hoc explanations for black-box AI models?
Contents
How can we provide post-hoc explanations for black-box AI models?#
Contributor: Joy Lin, Senior AI Technical Consultant
Introduction#
Interpretability and explainability have been the recent buzzwords in explainable AI as an attempt to decipher how models derive predictions. As AI is gaining wider acceptance and adoption, stakeholders are increasingly requesting, sometimes under legal requirements, for an explanation on how the model reaches its decision, in order to generate trust in the predictions. Scenarios include: providing a valid reason for rejecting a bank loan, or how various features help in categorising a medical disease.
Explanations come in useful:
during model development for error analysis and sense-checking
after model deployment to increase stakeholder and end user trust, avoiding significant social or financial impact
during model maintenance to detect drift, bias, or performance changes to guide re-training
Interpretable (Glass-box) VS Explainable (Black-box) Models#
There are two broad approaches to deriving explanations, which is tied to the type of model used: interpretability (using glass-box models) or explainability (using black-box models). The table and diagram below shows the distinction between these approaches.
Interpretability (Glass-box) |
Explainability (Black-box) |
|
|---|---|---|
Transparency |
Highly translucent |
Opaque |
Model performance |
Less powerful |
More powerful |
Relationship to model |
Model-specific |
Model-agnostic |
Derivation of explanations |
Via model’s functional form |
Via post-hoc analysis of model inputs and outputs |
Outcome |
Exact explanation |
Approximate explanation |
Examples |
Linear regression model coefficients |
Permutation feature importance ranking |
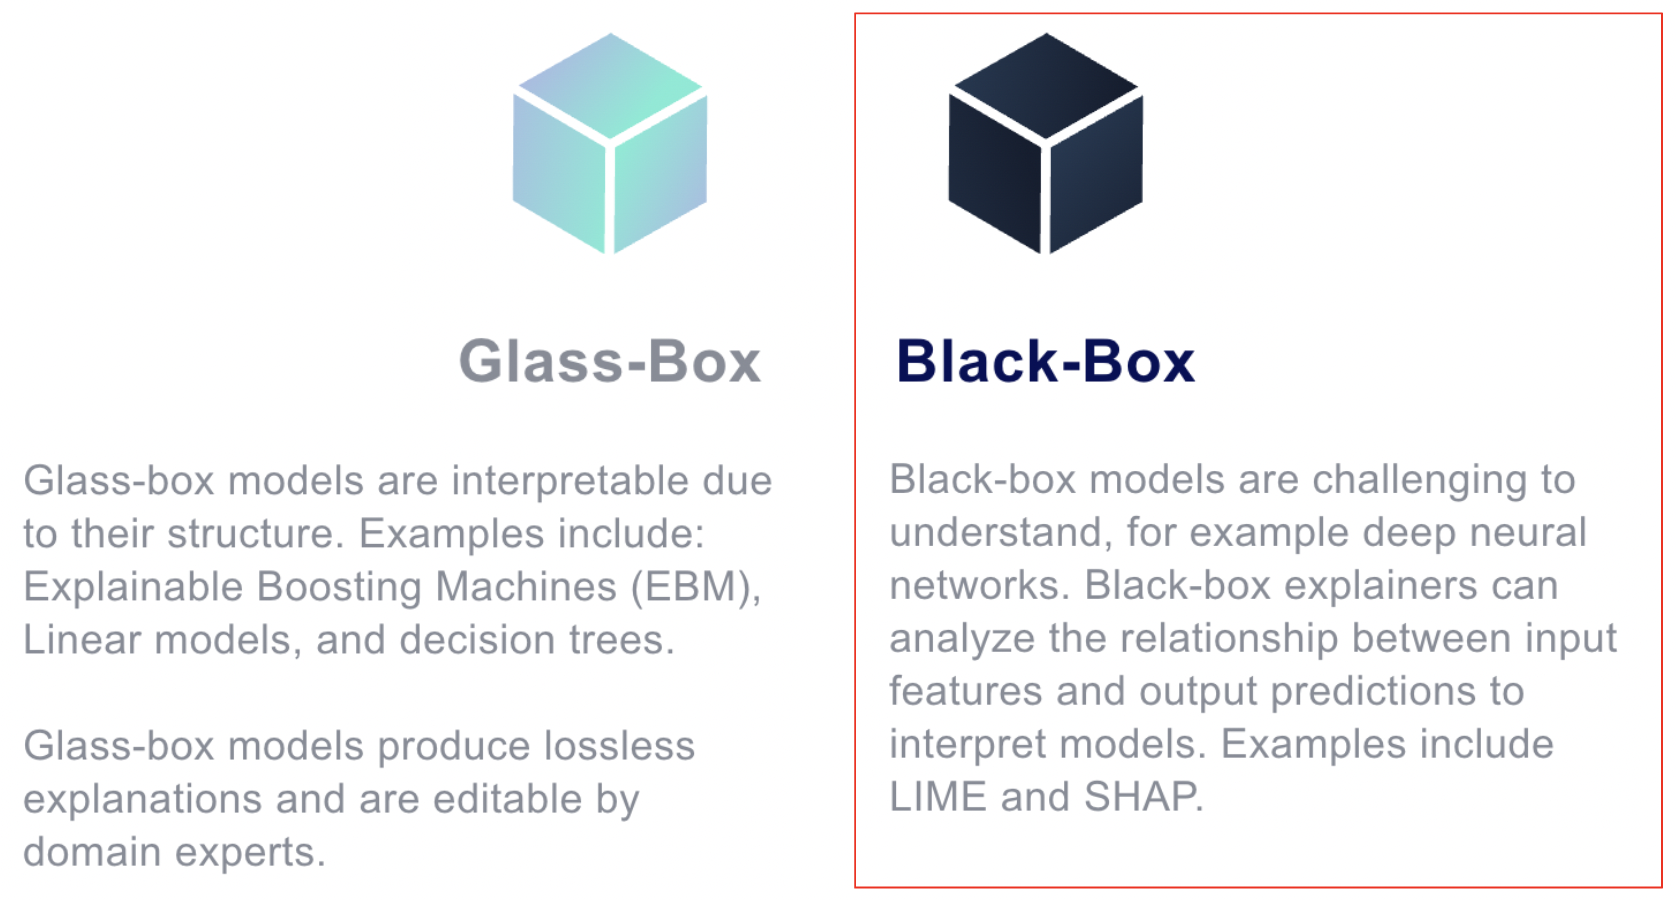
With glass-box models, explanations are inherent to the model, and exact.
With black-box models, explanations require additional post-hoc analysis of the trained model, and explanations are approximate only. Due to this, they need to be used with caution as explanations may vary between runs or when input data changes slightly.
In this article, we focus only on explainability methods for black-box models.
A. Understanding feature importance and relationship between inputs and outputs of the model#
Global model-agnostic methods describe how input features affect the output prediction on average. In particular, these methods tell us i) the importance of each feature, and ii) how it impacts the prediction (positive, neutral, or negative). They can be applied to black-box models like tree-based models and neural networks.
Examples:
Permutation feature importance: measures the importance of a feature as an increase in loss when the feature is permuted.
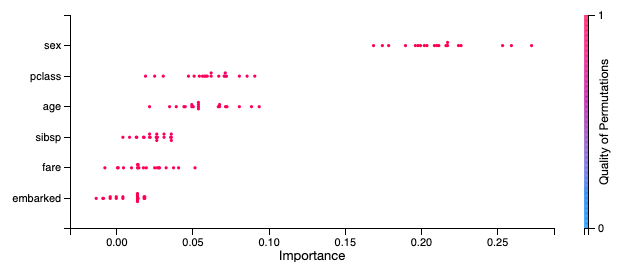 [Source] In the Titanic dataset, passenger gender is the most important feature to survival outcome, and about twice as important as passenger class and age.
SHAP (SHapley Additive exPlanations): globally estimates the contribution of every input feature with a combination of high/low and positive/negative Shapley value(s). Useful for sense-checking feature-target relationship.
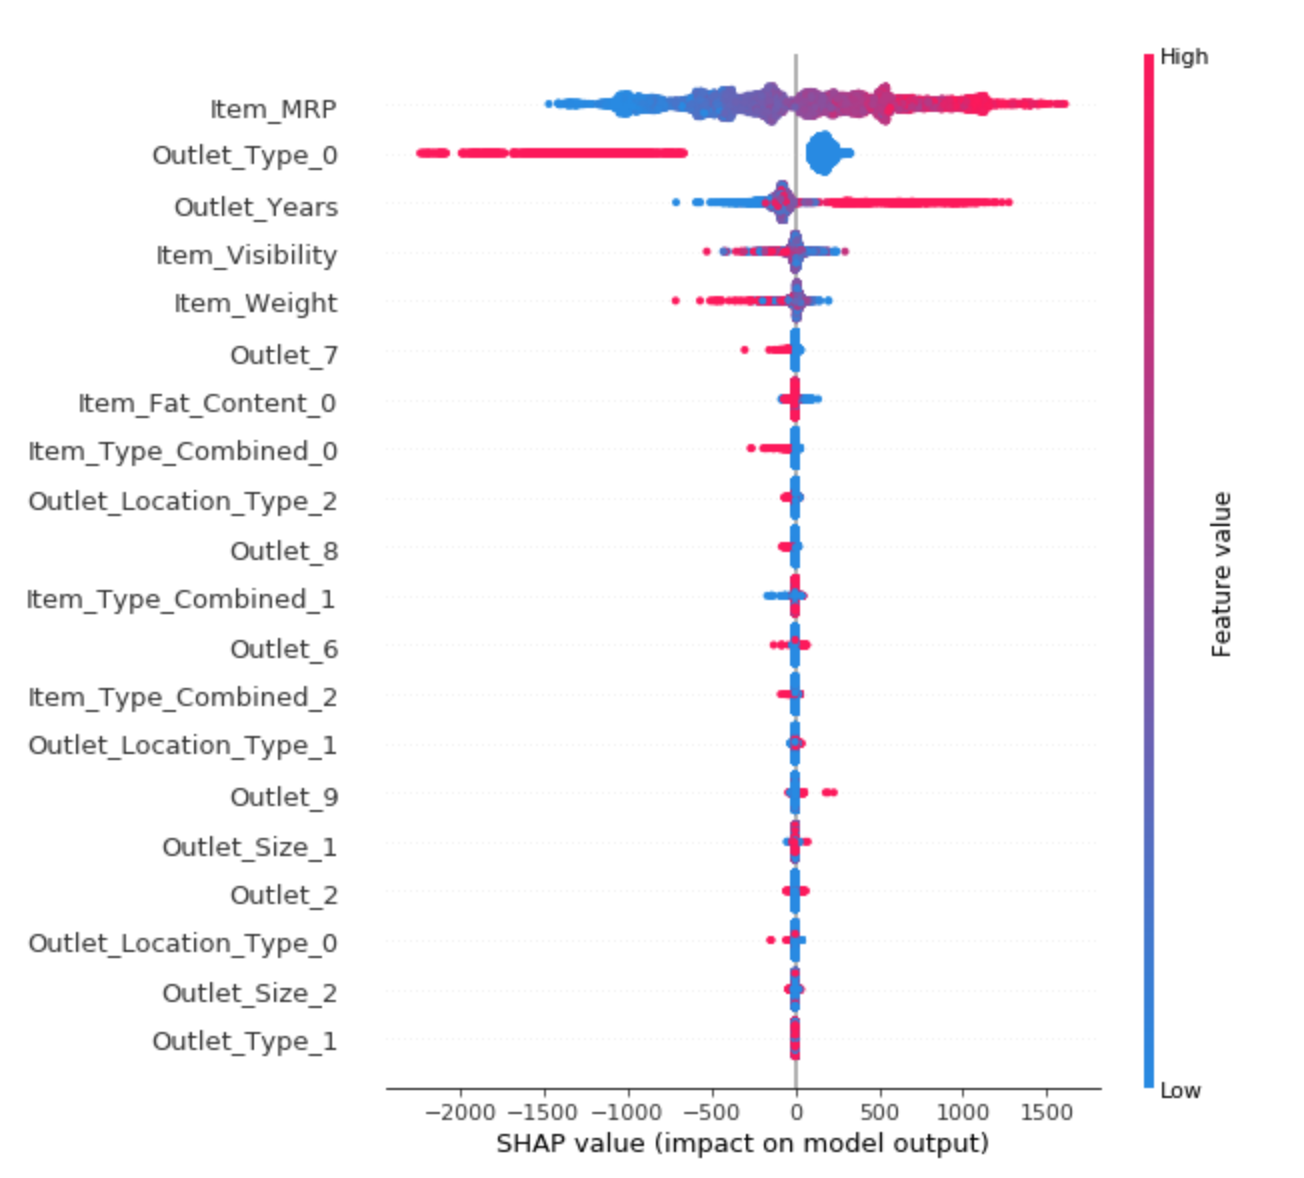 [Source] Summary plot of feature importance and feature effects, where each dot represents an instance per feature.
Partial Dependence Plot (PDP): shows the marginal impact that one or two features have on the predictions. Useful to deep dive and understand the direction of the relationship between specific feature(s) and the target, although limited to easy visualisation of maximum two features.
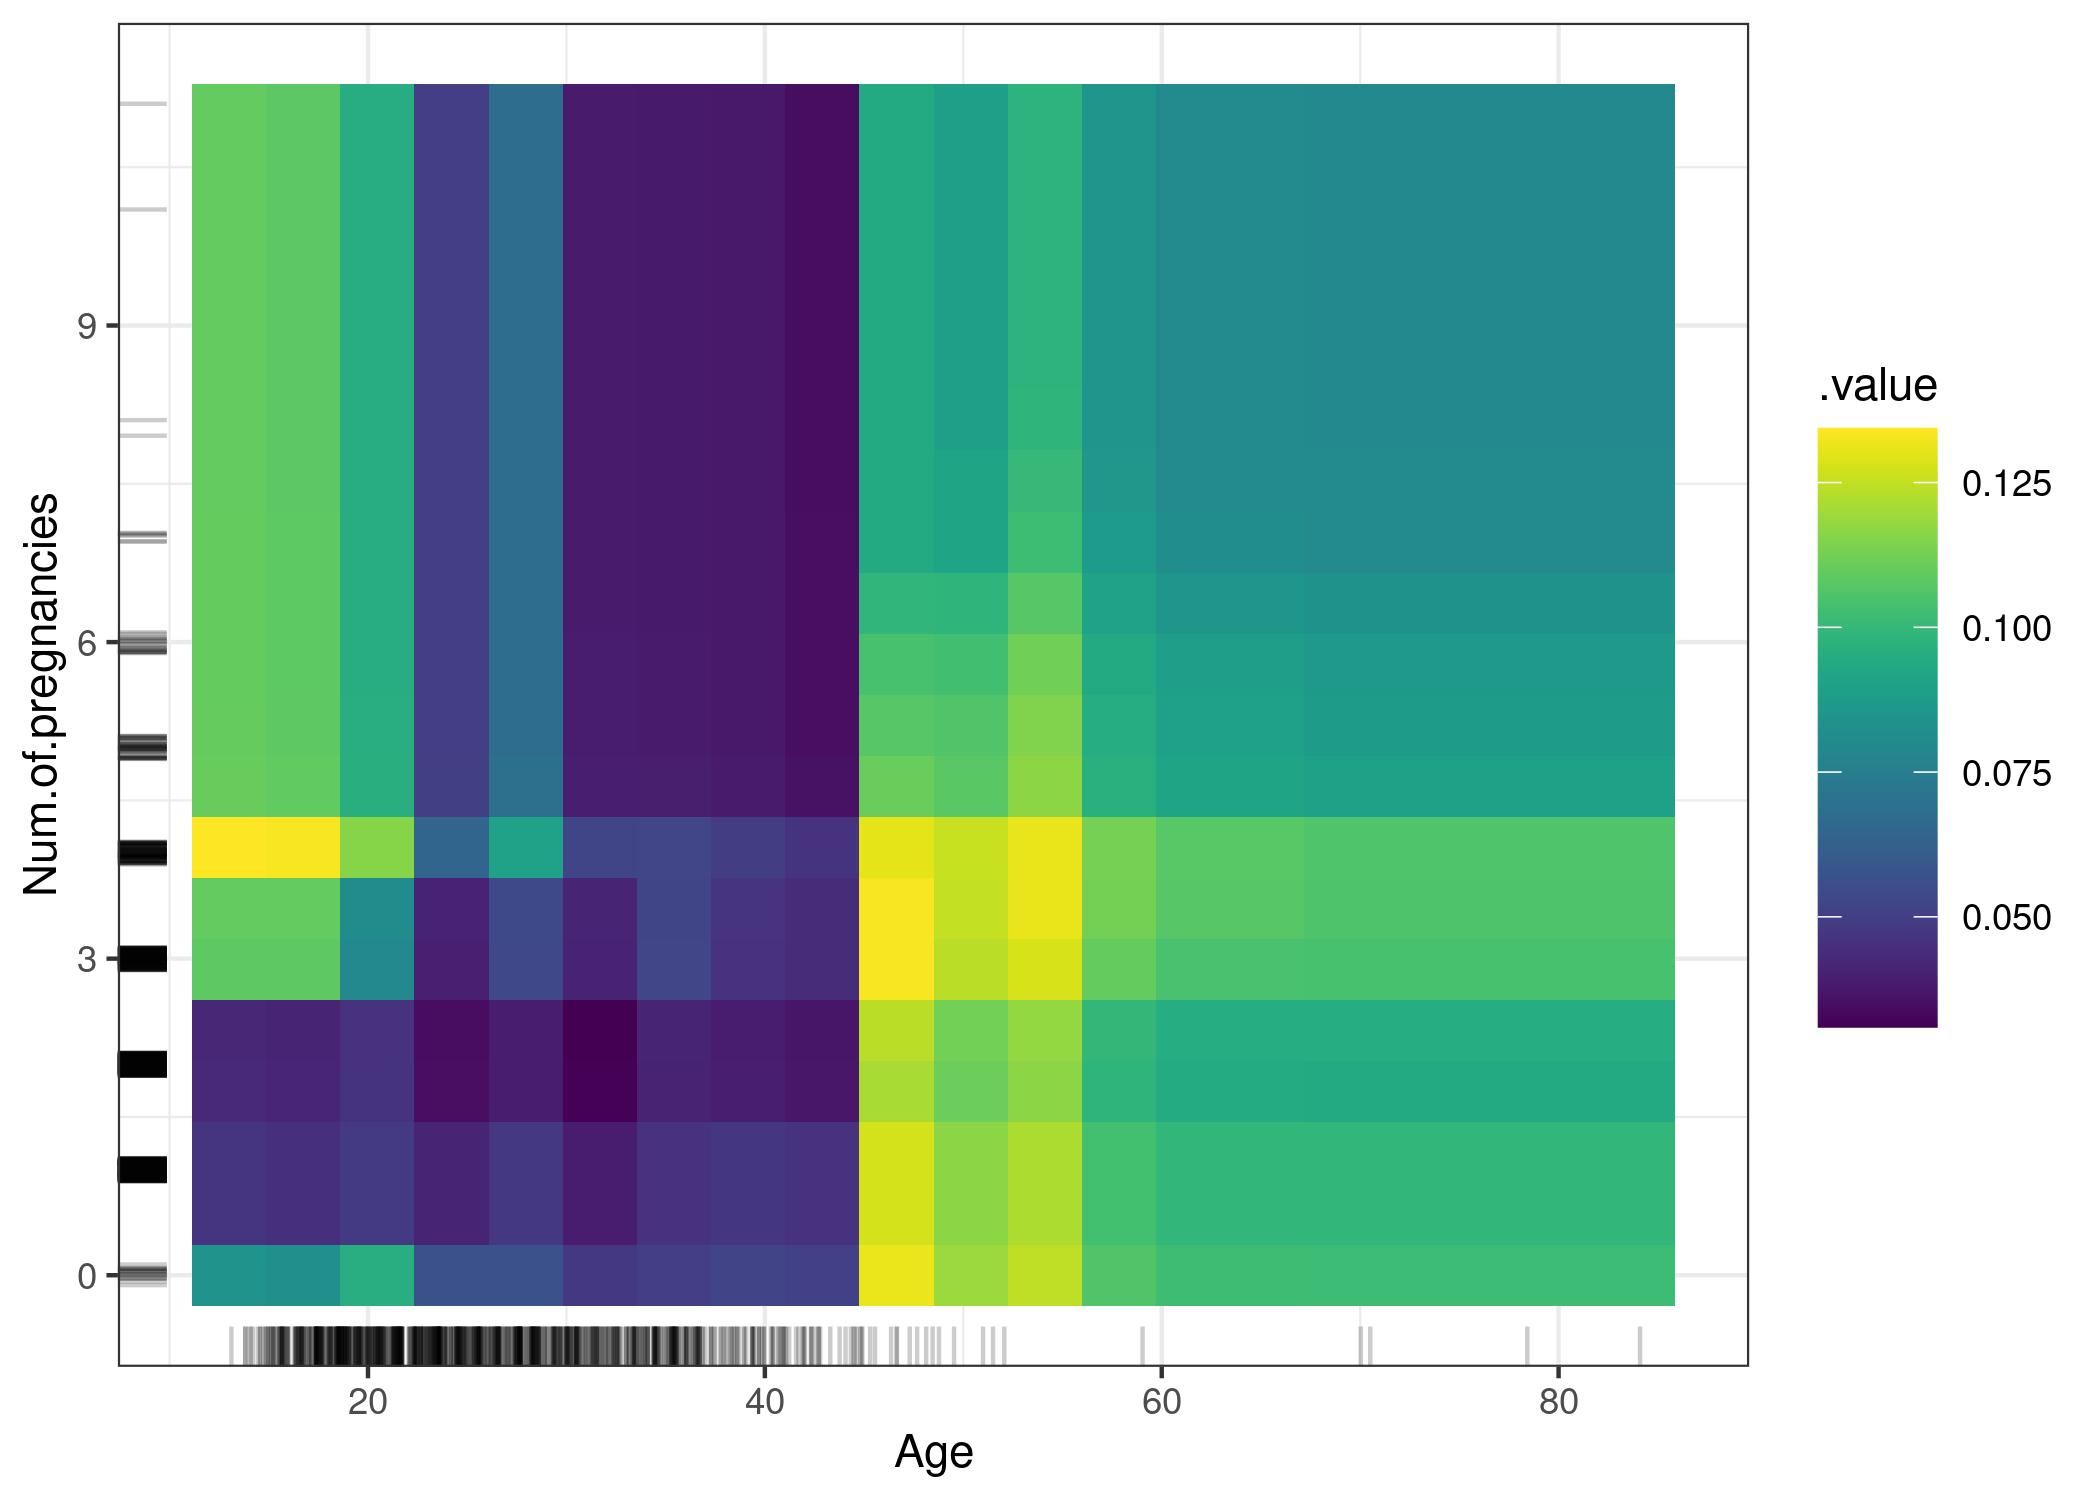 [Source] PDP of cancer probability VS the interaction of age and number of pregnancies. The plot shows the increase in cancer probability at 45. For ages below 25, women who had 1 or 2 pregnancies have a lower predicted cancer risk, compared to women who had 0 or more than 2 pregnancies. Caution: These relationships should not be interpreted causally.
B. Explaining learned representations inside a neural network#
A neural network can have multiple nodes and layers where input data undergo complex mathematical operations to output predictions. However increasing network density makes it nearly impossible to represent these complexities in a human-readable way. Instead, we use visual representations of data inside a neural network to understand the predictions.
Examples:
Learned features
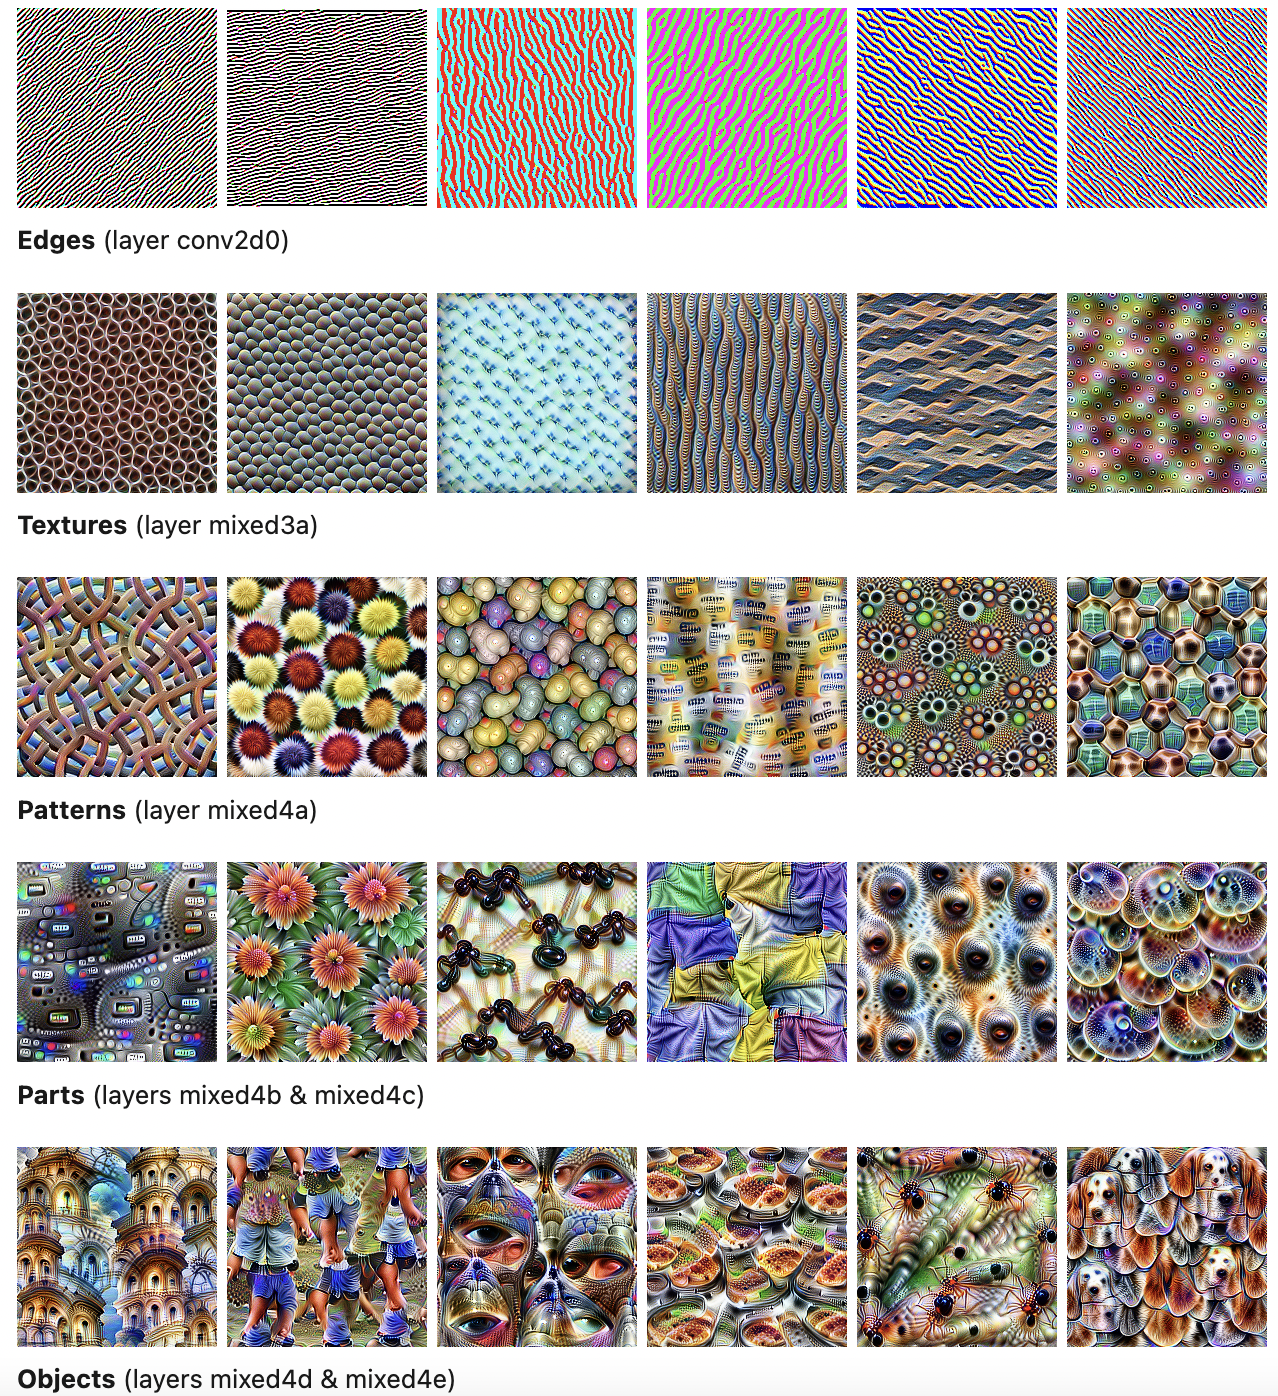
A model can learn - with increasing complexity across the network layers - the various edges, textures, patterns, parts, and eventually objects in images. Assessing these network layers helps you understand the features learned (or missed).
Similarly, models can learn features from text or tabular data.
Pixel attribution using saliency maps
Saliency maps provide another visualisation using ranked coloured pixels to indicate their contribution to the model prediction.
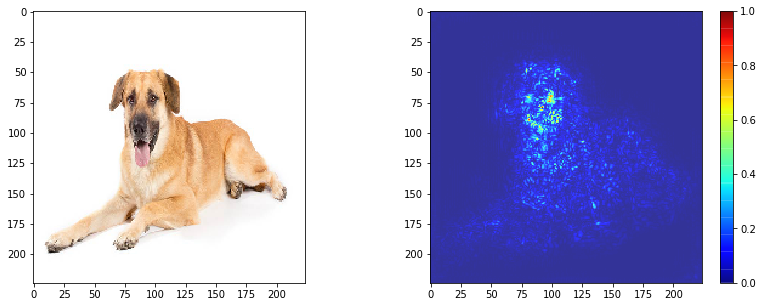 [Source] Input image (left) and corresponding saliency map (right).